Figure 18-8
This figure below shows the labor market for automobile workers. The curve labeled S is the labor supply curve, and the curves labeled D1 and D2 are the labor demand curves. On the horizontal axis, L represents the quantity of labor in the market. 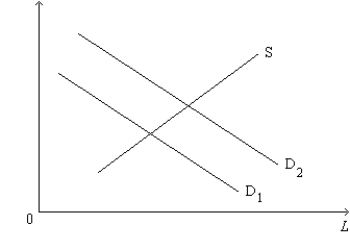
-Refer to Figure 18-8. Which of the following events would most likely explain the shift of the labor-demand curve from D1 to D2?
A) The price of automobiles decreased.
B) A large number of immigrants entered the automobile-worker market.
C) A technological advance increased the marginal product of automobile workers.
D) All of the above are correct.
Correct Answer:
Verified
Q180: Suppose that the market for labor is
Q181: Figure 18-10 Q182: Figure 18-9 Q183: Suppose that technological progress increases the productivity Q184: Figure 18-9 Q186: Consider the labor market for computer programmers. Q187: Figure 18-10 Q188: Suppose that the market for labor is Q189: Figure 18-9 Q190: Figure 18-10 Unlock this Answer For Free Now! View this answer and more for free by performing one of the following actions Scan the QR code to install the App and get 2 free unlocks Unlock quizzes for free by uploading documents![]()
![]()
![]()
![]()
![]()
![]()

