Figure 18-8
This figure below shows the labor market for automobile workers. The curve labeled S is the labor supply curve, and the curves labeled D1 and D2 are the labor demand curves. On the horizontal axis, L represents the quantity of labor in the market. 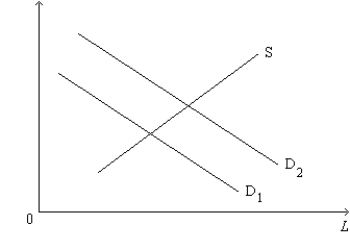
-Refer to Figure 18-8. What is measured along the vertical axis on the graph?
A) the quantity of automobiles produced
B) the price of automobiles
C) the wage paid to automobile workers
D) time spent by workers producing automobiles
Correct Answer:
Verified
Q158: The Black Death in fourteenth-century Europe resulted
Q159: Figure 18-7 Q160: Suppose that a large lake in the Q161: Consider the market for medical doctors. Suppose Q162: Consider the market for university economics professors. Q164: Consider the labor market for short-order cooks. Q165: Scenario 18-6 Q166: Consider the market for medical doctors. Suppose Q167: Consider the market for medical doctors. Suppose Q168: Consider the market for university economics professors.![]()
Rocchetta Industries manufactures and supplies bottled
Unlock this Answer For Free Now!
View this answer and more for free by performing one of the following actions

Scan the QR code to install the App and get 2 free unlocks

Unlock quizzes for free by uploading documents