Figure 18-1. The figure shows the relationship between the number of mechanics hired and the number of car repairs performed per day at a car-repair shop. 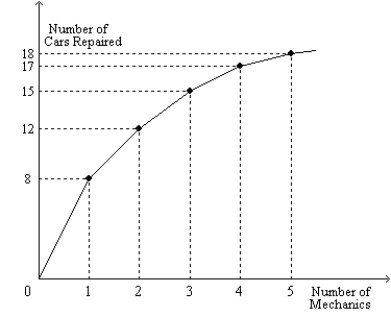
-Refer to Figure 18-1. The relationship depicted on the graph is called a _______ function.
Correct Answer:
Verified
Q85: Jen's wage decreased, and she responded by
Q92: The substantial increases in output per worker
Q96: A competitive, profit-maximizing pays its workers a
Q101: Over the last 60 or so years,
Q110: Over time, there have been technological advances
Q116: Suppose a shift of the demand curve
Q118: Angie was the last worker hired by
Q555: Figure 18-1. The figure shows the relationship
Q556: Figure 18-1. The figure shows the relationship
Q560: Figure 18-1. The figure shows the relationship
Unlock this Answer For Free Now!
View this answer and more for free by performing one of the following actions

Scan the QR code to install the App and get 2 free unlocks

Unlock quizzes for free by uploading documents