Multiple Choice
Figure 19-1 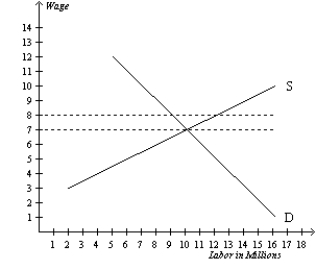
-Refer to Figure 19-1. Suppose the local labor market was in equilibrium to begin with but then the largest local employer decided to change its compensation scheme to $8 as shown. Which of the following compensation schemes could the graph be illustrating?
A) An efficiency wage.
B) Discrimination.
C) A compensating differential.
D) The superstar phenomenon.
Correct Answer:
Verified
Related Questions
Q186: Figure 19-2 Q399: Figure 19-1 Q400: When employers pay an efficiency wage above![]()
![]()


