The following diagram shows two budget lines: A and B. 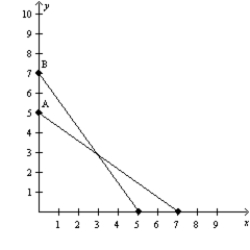 Which of the following could explain the change in the budget line from A to B?
A) a decrease in income and a decrease in the price of X
B) a decrease in income and an increase in the price of X
C) an increase in income and a decrease in the price of X
D) an increase in income and an increase in the price of X
Correct Answer:
Verified
Q122: A budget constraint illustrates the
A)prices that a
Q129: Suppose a consumer has an income of
Q442: Suppose a consumer has an income of
Q445: Karen, Tara, and Chelsea each buy ice
Q447: Scenario 21-1
Suppose the price of hot wings
Q448: A budget constraint shows
A)the maximum utility that
Q459: Budget constraints exist for consumers because
A)their utility
Q460: Jack and Diane each buy pizza and
Q507: The following diagram shows a budget constraint
Q508: The following diagram shows a budget constraint
Unlock this Answer For Free Now!
View this answer and more for free by performing one of the following actions

Scan the QR code to install the App and get 2 free unlocks

Unlock quizzes for free by uploading documents