Figure 21-2 The downward-sloping line on the figure represents a consumer's budget
constraint. 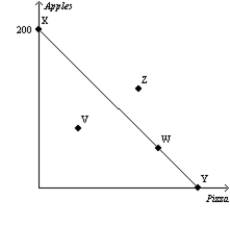
-Refer to Figure 21-2. If the consumer's income is $100, then what is the price of an apple?
A) $0.50
B) $0.75
C) $1.00
D) $1.25
Correct Answer:
Verified
Q384: Figure 21-1 The downward-sloping line on the
Q385: Suppose Alyssa likes oranges twice as much
Q386: Figure 21-2 The downward-sloping line on the
Q387: Figure 21-1 The downward-sloping line on the
Q388: Figure 21-2 The downward-sloping line on the
Q390: A consumer likes two goods: hamburgers and
Q391: Suppose that Milton likes to consume one
Q392: Hold Jared's preferences for pizza and Pepsi
Q393: Figure 21-1 The downward-sloping line on the
Q394: Which of the following best describes why
Unlock this Answer For Free Now!
View this answer and more for free by performing one of the following actions

Scan the QR code to install the App and get 2 free unlocks

Unlock quizzes for free by uploading documents