Figure 21-15 On the graph, Qx represents the quantity of good x and Qy represents the quantity of good y. The lines drawn on the graph represent three of Barbara's indifference curves. 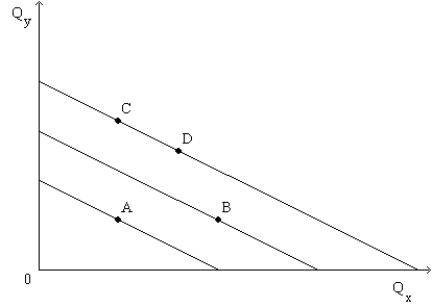
-Refer to Figure 21-15. Barbara is happier at
A) point B than at point A.
B) point B than at point C.
C) point C than at point D.
D) All of the above are correct.
Correct Answer:
Verified
Q166: Consider the indifference curve map for nickels
Q169: "Left" gloves and "right" gloves provide a
Q367: Suppose Caroline is indifferent between tea and
Q368: A consumer likes two goods: pizza and
Q369: When two goods are perfect complements, the
Q370: When two goods are perfect complements, the
Q371: Figure 21-15 On the graph, Qx represents
Q374: A consumer's preferences for right shoes and
Q375: Suppose Caroline will only drink a cup
Q377: When two goods are perfect substitutes, the
A)indifference
Unlock this Answer For Free Now!
View this answer and more for free by performing one of the following actions

Scan the QR code to install the App and get 2 free unlocks

Unlock quizzes for free by uploading documents