Figure 21-15 On the graph, Qx represents the quantity of good x and Qy represents the quantity of good y. The lines drawn on the graph represent three of Barbara's indifference curves. 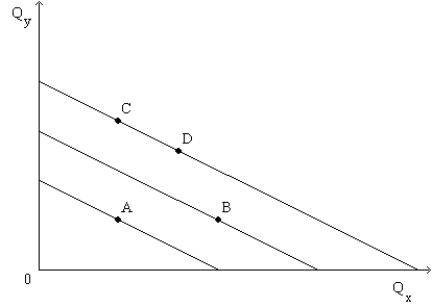
-Refer to Figure 21-15. For Barbara, goods x and y are
A) imperfect complements.
B) imperfect substitutes.
C) perfect substitutes.
D) perfect complements.
Correct Answer:
Verified
Q357: Which of the following is a property
Q358: Which of the following is not a
Q359: A set of indifference curves that are
Q360: Figure 21-14 Q361: When two goods are perfect substitutes, the Q363: When two goods are perfect complements, the Q364: Suppose Dave always uses two lemon wedges Q365: Suppose that Sam likes pears twice as Q366: When two goods are perfect substitutes, the Q367: Suppose Caroline is indifferent between tea and![]()
A)indifference
Unlock this Answer For Free Now!
View this answer and more for free by performing one of the following actions

Scan the QR code to install the App and get 2 free unlocks

Unlock quizzes for free by uploading documents