Figure 21-14 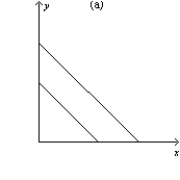
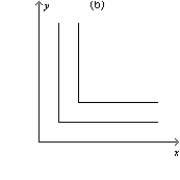
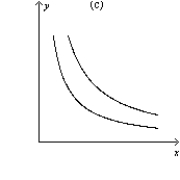
-Refer to Figure 21-14. Which of the graphs illustrates indifference curves for which the marginal rate of substitution varies?
A) graph a
B) graph b
C) graph c
D) All of the above are correct.
Correct Answer:
Verified
Q341: Indifference curves that cross would suggest that
A)the
Q342: Figure 21-14 Q343: Figure 21-14 Q344: Janet prefers cashews to almonds. She prefers Q345: When indifference curves are bowed in toward Q347: Which of the following is a property Q348: Higher indifference curves are preferred to lower Q349: The bowed shape of the indifference curve Q350: Figure 21-14 Q351: Figure 21-14 Unlock this Answer For Free Now! View this answer and more for free by performing one of the following actions Scan the QR code to install the App and get 2 free unlocks Unlock quizzes for free by uploading documents![]()
![]()
![]()
![]()

