The following diagram shows one indifference curve representing the preferences for goods X and Y for one consumer. 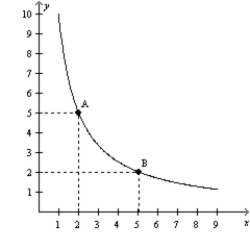 What is the marginal rate of substitution between points A and B?
A) 2/5
B) 1
C) 5/2
D) 3
Correct Answer:
Verified
Q305: Figure 21-11 Q310: Figure 21-13 Q323: The rate at which a consumer is Q324: The marginal rate of substitution is Q326: Clark enjoys fishing and hunting. He divides Q327: The slope of an indifference curve is Q328: If an indifference curve is bowed in Q329: As long as a consumer remains on Q330: Bundle L contains 10 units of good Q336: Indifference curves tend to be bowed inward![]()
![]()
A)the slope
A)the
Unlock this Answer For Free Now!
View this answer and more for free by performing one of the following actions

Scan the QR code to install the App and get 2 free unlocks

Unlock quizzes for free by uploading documents