Multiple Choice
Figure 21-11 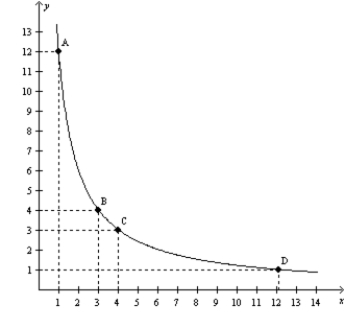
-Refer to Figure 21-11. The graph illustrates
A) a typical budget constraint.
B) a typical indifference curve.
C) an indifference curve where goods X and Y are perfect complements.
D) an indifference curve where goods X and Y are perfect substitutes.
Correct Answer:
Verified
Related Questions

