Figure 21-24 The figure shows three indifference curves and a budget constraint for a certain consumer named Steve. 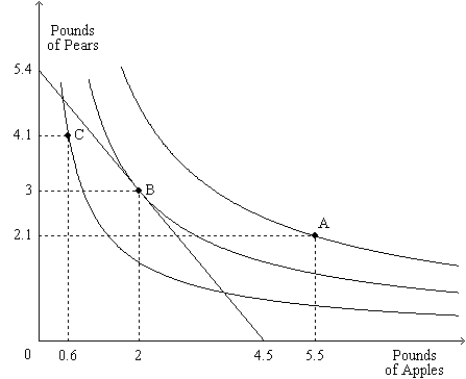
-Refer to Figure 21-24. About what percentage of his income is Steve spending on apples when he is at his optimum?
A) 33.3 percent
B) 38.2 percent
C) 44.4 percent
D) 56.7 percent
Correct Answer:
Verified
Q272: Figure 21-25 The figure pertains to a
Q273: Figure 21-25 The figure pertains to a
Q274: Figure 21-24 The figure shows three indifference
Q275: Figure 21-25 The figure pertains to a
Q276: Figure 21-25 The figure pertains to a
Q278: Frannie spends her income on rice and
Q279: Figure 21-25 The figure pertains to a
Q280: Figure 21-24 The figure shows three indifference
Q281: Indifference curves graphically represent
A)an income level sufficient
Q282: Irene is a vegetarian, so she does
Unlock this Answer For Free Now!
View this answer and more for free by performing one of the following actions

Scan the QR code to install the App and get 2 free unlocks

Unlock quizzes for free by uploading documents