Figure 21-23 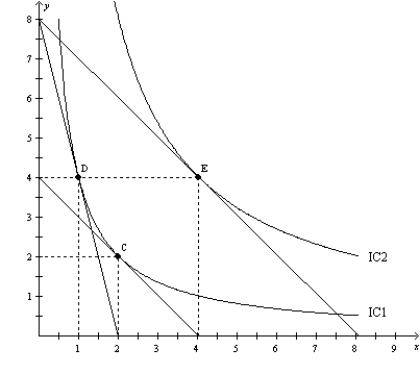
-Refer to Figure 21-23. When the price of X is $80, the price of Y is $20, and the consumer's income is $160, the consumer's optimal choice is D. Then the price of X decreases to $20. The income effect can be illustrated as the movement from
A) D to E.
B) D to C.
C) C to E.
D) E to D.
Correct Answer:
Verified
Q238: Figure 21-22 Q239: A consumer consumes two normal goods, coffee Q240: When the price of an inferior good Q241: Suppose that for Emily, DVDs and trips Q242: Which of the following descriptions best depicts Q244: Cashews and asparagus are normal goods. When Q245: Given a consumer's indifference map, the demand Q246: An individual's demand curve for a good Q247: Consider a consumer who purchases two goods, Q248: Figure 21-23 ![]()
![]()
Unlock this Answer For Free Now!
View this answer and more for free by performing one of the following actions

Scan the QR code to install the App and get 2 free unlocks

Unlock quizzes for free by uploading documents