Table 22-21
The following table shows the number of voters preferring various amounts of spending to develop a river to make it more attractive for canoeing and kayaking. 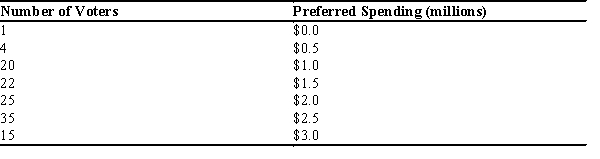
-Refer to Table 22-21. Suppose on election day that the voters with a preference for less than $1.5 million do not show up to vote on a choice to spend either $2 million or $2.5 million. In this case, what is the preferred spending amount of the median voter (among those who actually cast a vote) ?
A) $2 million and $2 million wins.
B) $2 million, but $2.5 million wins.
C) $2.5 million, and $2.5 million wins.
D) $2.5 million, but $2 million wins.
Correct Answer:
Verified
Q257: Table 22-18
The following table shows the preferences
Q258: Table 22-17 Q259: Table 22-18 Q260: Scenario 22-3 Q261: Table 22-19 Q263: Table 22-19 Q264: Scenario 22-4 Q265: Table 22-20 Q266: Scenario 22-4 Q267: Table 22-22![]()
The following table shows the preferences
At issue in a particular city
The 600 voters of Appleton are
The 600 voters of Appleton are
Three members of the DiCarlo family,
The table below shows the preferred
Three members of the DiCarlo family,
The town of Fairview is considering
Unlock this Answer For Free Now!
View this answer and more for free by performing one of the following actions

Scan the QR code to install the App and get 2 free unlocks

Unlock quizzes for free by uploading documents