Table 24-9
The table below lists the per gallon prices of gas and milk for the months of April, May, and June. Assume that the typical consumer buys 60 gallons of gas and 4 gallons of milk each month, and that April is the base period. 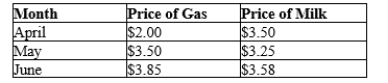
-Refer to Table 24-9. What is the inflation rate for May?
A) 66.4%
B) 60.1%
C) -4.1%
D) 10%
Correct Answer:
Verified
Q163: Which is the most accurate statement about
Q168: Most,but not all,athletic apparel sold in the
Q170: Price changes from year to year are
Q171: Which of the following is the most
Q174: One of the differences between the GDP
Q179: In 1979 and 1980,
A)the U.S.inflation rate as
Q505: Table 24-9
The table below lists the per
Q506: Table 24-10
The table below shows the prices
Q511: Table 24-10
The table below shows the prices
Q514: Table 24-10
The table below shows the prices
Unlock this Answer For Free Now!
View this answer and more for free by performing one of the following actions

Scan the QR code to install the App and get 2 free unlocks

Unlock quizzes for free by uploading documents