Figure 27-3
The following figure shows the utility function for Paul. 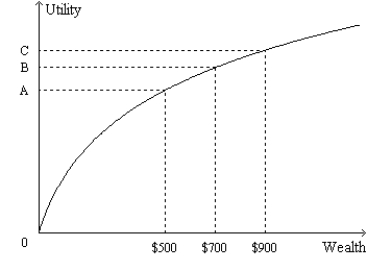
-Refer to Figure 27-3.Suppose the vertical distance between the points (0,A) and (0,B) is 10.If his wealth increased from $700 to $900,then
A) Paul's utility would increase by less than 10 units.
B) Paul's utility would increase by more than 10 units.
C) Paul's utility would increase by exactly 10 units.
D) Any of the above could be correct.
Correct Answer:
Verified
Q32: Figure 27-5.The figure shows a utility function
Q33: A measure of the volatility of a
Q35: Figure 27-4.The figure shows a utility function
Q36: Figure 27-5.The figure shows a utility function
Q38: Figure 27-3
The following figure shows the utility
Q39: Diversification of a portfolio
A)can eliminate market risk,but
Q40: As the number of stocks in a
Q41: Given that Tamar is a risk-averse person,she
Q42: The last $2,000 of Rolanda's wealth adds
Q167: The largest reduction in a portfolio's risk
Unlock this Answer For Free Now!
View this answer and more for free by performing one of the following actions

Scan the QR code to install the App and get 2 free unlocks

Unlock quizzes for free by uploading documents