Figure 28-2 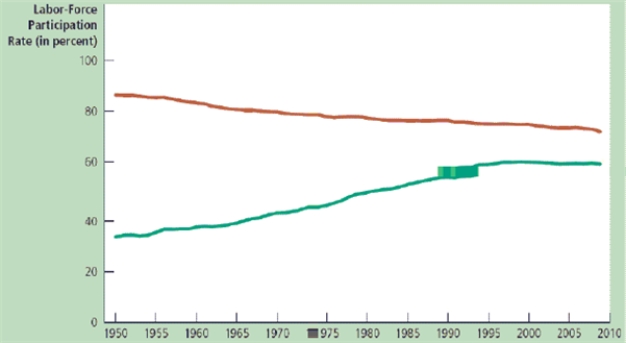
-Refer to Figure 28-2.What do the two lines in the figure measure?
A) The top line is the labor force participation rate,and the bottom line is the unemployment rate.
B) The top line is the labor force participation rates of the college-educated population,and bottom line is the labor force participation rates of the high-school-educated population.
C) The top line is the foreign labor force participation rate,and the bottom line is the domestic labor force participation rate.
D) The top line is the labor force participation rates of men,and the bottom line is the labor force participation rates of women.
Correct Answer:
Verified
Q102: Which of the following is not a
Q103: Economists at the Congressional Budget Office estimated
Q104: Which of the following is correct?
A)The labor-force
Q105: According to 2014 data on the U.S.population,which
Q106: Which of the following is not a
Q108: According to 2014 data on the U.S.population,which
Q110: Which of the following is correct?
A)In the
Q111: Which of the following is not a
Q112: According to 2014 data on the U.S.population,which
Q304: Over the past several decades, the difference
Unlock this Answer For Free Now!
View this answer and more for free by performing one of the following actions

Scan the QR code to install the App and get 2 free unlocks

Unlock quizzes for free by uploading documents