Figure 30-3.On the graph,MS represents the money supply and MD represents money demand.The usual quantities are measured along the axes. 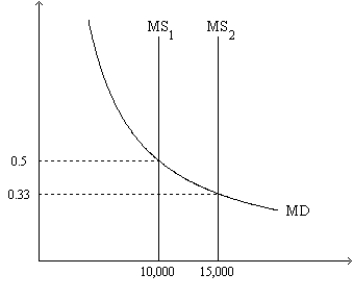
-Refer to Figure 30-3.Which of the following events could explain a shift of the money-supply curve from MS1 to MS2?
A) an increase in the value of money
B) a decrease in the price level
C) an open-market purchase of bonds by the Federal Reserve
D) the Federal Reserve sells bonds.
Correct Answer:
Verified
Q93: On a given morning,Franco sold 40 pairs
Q94: Figure 30-2.On the graph,MS represents the money
Q95: On a Sunday morning,Tom sold 300 cups
Q96: Figure 30-3.On the graph,MS represents the money
Q97: Figure 30-3.On the graph,MS represents the money
Q99: Figure 30-2.On the graph,MS represents the money
Q100: Figure 30-2.On the graph,MS represents the money
Q102: On its web site,your bank posts the
Q103: Your nominal wage increases from $12 per
Q147: Last year, you earned a nominal wage
Unlock this Answer For Free Now!
View this answer and more for free by performing one of the following actions

Scan the QR code to install the App and get 2 free unlocks

Unlock quizzes for free by uploading documents