Figure 30-3.On the graph,MS represents the money supply and MD represents money demand.The usual quantities are measured along the axes. 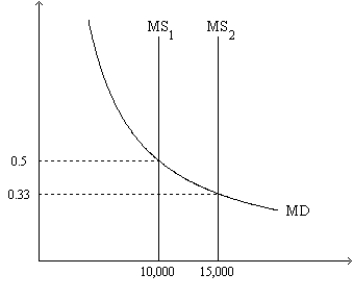
-Refer to Figure 30-3.Suppose the relevant money-supply curve is the one labeled MS1;also suppose the economy's real GDP is 30,000 for the year.If the money market is in equilibrium,then the velocity of money is approximately
A) 3.0
B) 6.0
C) 9.0
D) 1.5
Correct Answer:
Verified
Q80: Figure 30-1 Q81: Economic variables whose values are measured in Q82: Economic variables whose values are measured in Q83: Figure 30-2.On the graph,MS represents the money Q84: Figure 30-2.On the graph,MS represents the money Q86: Figure 30-3.On the graph,MS represents the money Q87: Figure 30-2.On the graph,MS represents the money Q88: Figure 30-2.On the graph,MS represents the money Q90: Figure 30-3.On the graph,MS represents the money Q152: The price level is a![]()
A)relative variable.
B)dichotomous variable
C)real
Unlock this Answer For Free Now!
View this answer and more for free by performing one of the following actions

Scan the QR code to install the App and get 2 free unlocks

Unlock quizzes for free by uploading documents