Figure 30-3.On the graph,MS represents the money supply and MD represents money demand.The usual quantities are measured along the axes. 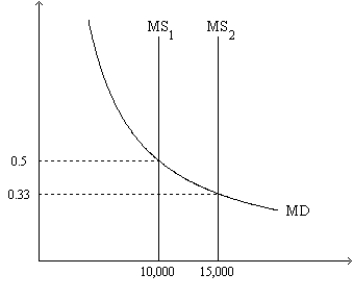
-Refer to Figure 30-3.If the relevant money-supply curve is the one labeled MS2,then
A) when the money market is in equilibrium,one dollar purchases about one-third of a basket of goods and services.
B) when the money market is in equilibrium,one unit of goods and services sells for 33 cents.
C) there is an excess demand for money if the value of money in terms of goods and services is 0.5.
D) All of the above are correct.
Correct Answer:
Verified
Q91: Nominal GDP measures
A)the total quantity of final
Q92: Figure 30-1 Q93: On a given morning,Franco sold 40 pairs Q94: Figure 30-2.On the graph,MS represents the money Q95: On a Sunday morning,Tom sold 300 cups Q97: Figure 30-3.On the graph,MS represents the money Q98: Figure 30-3.On the graph,MS represents the money Q99: Figure 30-2.On the graph,MS represents the money Q100: Figure 30-2.On the graph,MS represents the money Q147: Last year, you earned a nominal wage![]()
Unlock this Answer For Free Now!
View this answer and more for free by performing one of the following actions

Scan the QR code to install the App and get 2 free unlocks

Unlock quizzes for free by uploading documents