Figure 30-3.On the graph,MS represents the money supply and MD represents money demand.The usual quantities are measured along the axes. 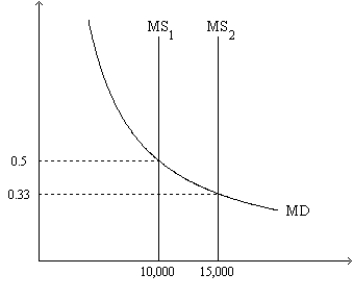
-Refer to Figure 30-3.If the relevant money-supply curve is the one labeled MS1,then the equilibrium price level is
A) 0.5 and the equilibrium value of money is 2.
B) 2 and the equilibrium value of money is 0.5.
C) 0.5 and the equilibrium value of money cannot be determined from the graph.
D) 2 and the equilibrium value of money cannot be determined from the graph.
Correct Answer:
Verified
Q92: Figure 30-1 Q93: On a given morning,Franco sold 40 pairs Q94: Figure 30-2.On the graph,MS represents the money Q95: On a Sunday morning,Tom sold 300 cups Q96: Figure 30-3.On the graph,MS represents the money Q98: Figure 30-3.On the graph,MS represents the money Q99: Figure 30-2.On the graph,MS represents the money Q100: Figure 30-2.On the graph,MS represents the money Q102: On its web site,your bank posts the Q147: Last year, you earned a nominal wage![]()
Unlock this Answer For Free Now!
View this answer and more for free by performing one of the following actions

Scan the QR code to install the App and get 2 free unlocks

Unlock quizzes for free by uploading documents