Figure 30-2.On the graph,MS represents the money supply and MD represents money demand.The usual quantities are measured along the axes. 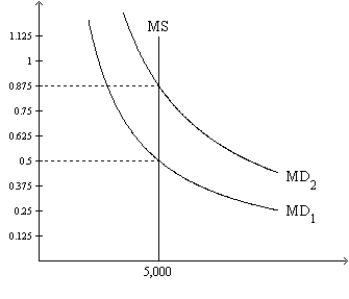
-Refer to Figure 30-2.Suppose the relevant money-demand curve is the one labeled MD1;also suppose the economy's real GDP is 20,000 for the year.If the money market is in equilibrium,then how many times per year is the typical dollar bill used to pay for a newly produced good or service?
A) 4
B) 2
C) 8
D) 10
Correct Answer:
Verified
Q95: On a Sunday morning,Tom sold 300 cups
Q96: Figure 30-3.On the graph,MS represents the money
Q97: Figure 30-3.On the graph,MS represents the money
Q98: Figure 30-3.On the graph,MS represents the money
Q99: Figure 30-2.On the graph,MS represents the money
Q102: On its web site,your bank posts the
Q103: Your nominal wage increases from $12 per
Q104: The payments you make on your automobile
Q105: You find that to attract a sufficient
Q147: Last year, you earned a nominal wage
Unlock this Answer For Free Now!
View this answer and more for free by performing one of the following actions

Scan the QR code to install the App and get 2 free unlocks

Unlock quizzes for free by uploading documents