Figure 30-2.On the graph,MS represents the money supply and MD represents money demand.The usual quantities are measured along the axes. 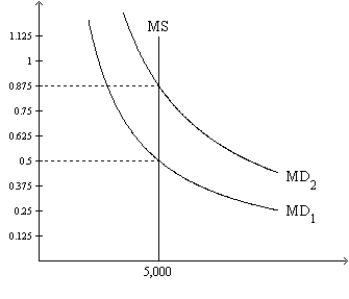
-Refer to Figure 30-2.If the relevant money-demand curve is the one labeled MD1,then
A) when the money market is in equilibrium,one dollar purchases one-half of a basket of goods and services.
B) when the money market is in equilibrium,one unit of goods and services sells for 2 dollars.
C) there is an excess demand for money if the value of money in terms of goods and services is 0.375.
D) All of the above are correct.
Correct Answer:
Verified
Q82: Economic variables whose values are measured in
Q83: Figure 30-2.On the graph,MS represents the money
Q84: Figure 30-2.On the graph,MS represents the money
Q85: Figure 30-3.On the graph,MS represents the money
Q86: Figure 30-3.On the graph,MS represents the money
Q88: Figure 30-2.On the graph,MS represents the money
Q90: Figure 30-3.On the graph,MS represents the money
Q91: Nominal GDP measures
A)the total quantity of final
Unlock this Answer For Free Now!
View this answer and more for free by performing one of the following actions

Scan the QR code to install the App and get 2 free unlocks

Unlock quizzes for free by uploading documents