Figure 30-2.On the graph,MS represents the money supply and MD represents money demand.The usual quantities are measured along the axes. 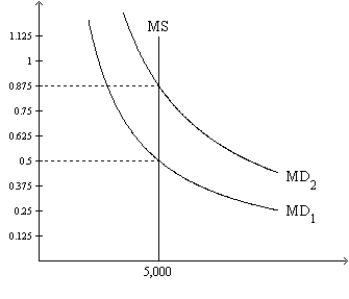
-Refer to Figure 30-2.If the relevant money-demand curve is the one labeled MD1,then the equilibrium value of money is
A) 0.5 and the equilibrium price level is 2.
B) 2 and the equilibrium price level is 0.5.
C) 0.5 and the equilibrium price level cannot be determined from the graph.
D) 2 and the equilibrium price level cannot be determined from the graph.
Correct Answer:
Verified
Q90: Figure 30-3.On the graph,MS represents the money
Q91: Nominal GDP measures
A)the total quantity of final
Q92: Figure 30-1 Q93: On a given morning,Franco sold 40 pairs Q95: On a Sunday morning,Tom sold 300 cups Q96: Figure 30-3.On the graph,MS represents the money Q97: Figure 30-3.On the graph,MS represents the money Q98: Figure 30-3.On the graph,MS represents the money Q99: Figure 30-2.On the graph,MS represents the money Q152: The price level is a![]()
A)relative variable.
B)dichotomous variable
C)real
Unlock this Answer For Free Now!
View this answer and more for free by performing one of the following actions

Scan the QR code to install the App and get 2 free unlocks

Unlock quizzes for free by uploading documents