Figure 30-2.On the graph,MS represents the money supply and MD represents money demand.The usual quantities are measured along the axes. 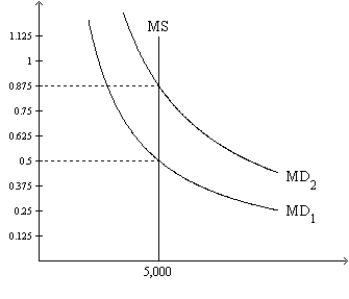
-Refer to Figure 30-2.What quantity is measured along the horizontal axis?
A) the price level
B) the real interest rate
C) the value of money
D) the quantity of money
Correct Answer:
Verified
Q78: When the money market is drawn with
Q79: The price level rises if either
A)money demand
Q80: Figure 30-1 Q81: Economic variables whose values are measured in Q82: Economic variables whose values are measured in Q84: Figure 30-2.On the graph,MS represents the money Q85: Figure 30-3.On the graph,MS represents the money Q86: Figure 30-3.On the graph,MS represents the money Q87: Figure 30-2.On the graph,MS represents the money Q88: Figure 30-2.On the graph,MS represents the money![]()
Unlock this Answer For Free Now!
View this answer and more for free by performing one of the following actions

Scan the QR code to install the App and get 2 free unlocks

Unlock quizzes for free by uploading documents