Figure 30-1 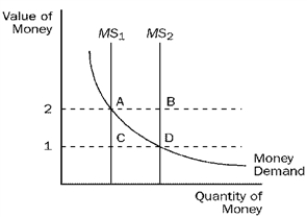
-Refer to Figure 30-1.When the money supply curve shifts from MS1 to MS2,
A) the demand for goods and services decreases.
B) the economy's ability to produce goods and services increases.
C) the equilibrium price level decreases.
D) None of the above is correct.
Correct Answer:
Verified
Q75: The price level rises if either
A)money demand
Q76: When the money market is drawn with
Q77: When the money market is drawn with
Q78: When the money market is drawn with
Q79: The price level rises if either
A)money demand
Q81: Economic variables whose values are measured in
Q82: Economic variables whose values are measured in
Q83: Figure 30-2.On the graph,MS represents the money
Q84: Figure 30-2.On the graph,MS represents the money
Q85: Figure 30-3.On the graph,MS represents the money
Unlock this Answer For Free Now!
View this answer and more for free by performing one of the following actions

Scan the QR code to install the App and get 2 free unlocks

Unlock quizzes for free by uploading documents