Figure 32-5
Refer to this diagram of the open-economy macroeconomic model to answer the questions below. 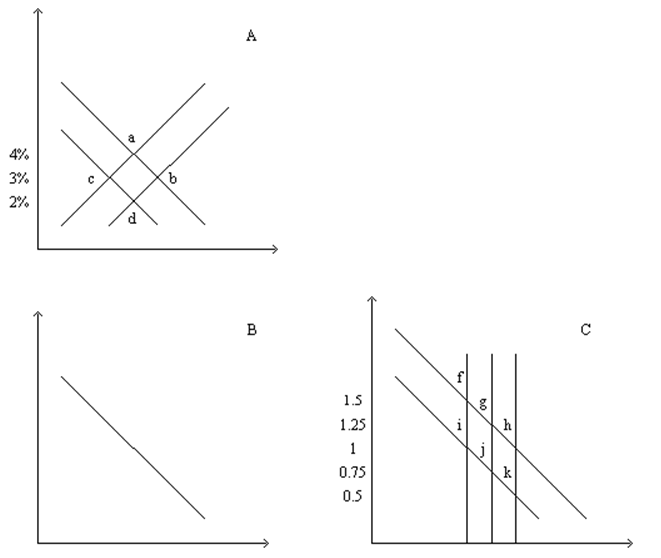
-Refer to Figure 32-4.Suppose that the government goes from a budget surplus to a budget deficit.The effects of the change could be illustrated by
A) shifting the demand curve in panel a to the right and the demand curve in panel c to the left.
B) shifting the demand curve in panel a to the left and the supply curve in panel c to the left.
C) shifting the supply curve in panel a to the right and the demand curve in panel c to the right.
D) shifting the supply curve in panel a to the left and the supply curve in panel c to the left.
Correct Answer:
Verified
Q39: If the U.S.government increased its deficit,then
A)U.S.bonds would
Q40: If the Japanese government raised its budget
Q41: Which of the following contains a list
Q42: From 2001 to 2004 the U.S.budget went
Q43: If the government of a country with
Q45: If the government of Canada increased its
Q46: Which of the following would not be
Q47: Figure 32-5
Refer to this diagram of the
Q48: In the 1980s,the U.S.government budget deficit rose.At
Q49: From 1980 to 1987,U.S.net capital outflows decreased.According
Unlock this Answer For Free Now!
View this answer and more for free by performing one of the following actions

Scan the QR code to install the App and get 2 free unlocks

Unlock quizzes for free by uploading documents