Figure 34-4.On the figure,MS represents money supply and MD represents money demand. 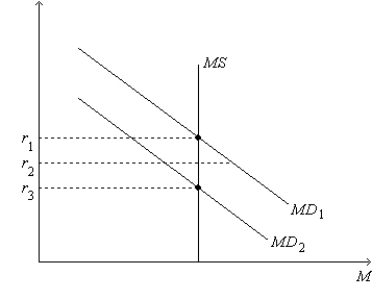
-Refer to Figure 34-4.Which of the following events could explain a shift of the money-demand curve from MD1 to MD2?
A) a decrease in the price level
B) a decrease in the cost of borrowing
C) an increase in the price level
D) an increase in the cost of borrowing
Correct Answer:
Verified
Q160: Changes in the interest rate
A)shift aggregate demand
Q168: For the U.S.economy,money holdings are a
A)large part
Q169: When the interest rate is above the
Q170: Changes in the interest rate help explain
A)only
Q171: The exchange-rate effect is based,in part,on the
Q174: According to the theory of liquidity preference,if
Q175: If the Federal Reserve increases the money
Q176: Figure 34-4.On the figure,MS represents money supply
Q177: When the interest rate is below the
Q178: Figure 34-4.On the figure,MS represents money supply
Unlock this Answer For Free Now!
View this answer and more for free by performing one of the following actions

Scan the QR code to install the App and get 2 free unlocks

Unlock quizzes for free by uploading documents