Figure 34-3. 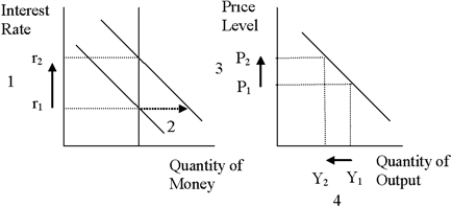
-Refer to Figure 34-3.For an economy such as the United States,what component of the demand for goods and services is most responsible for the decrease in output from Y1 to Y2?
A) consumption
B) investment
C) net exports
D) government spending
Correct Answer:
Verified
Q61: Figure 34-2.On the left-hand graph,MS represents the
Q62: Figure 34-3. Q63: According to liquidity preference theory,if the quantity Q64: Figure 34-2.On the left-hand graph,MS represents the Q66: Figure 34-2.On the left-hand graph,MS represents the Q67: Figure 34-2.On the left-hand graph,MS represents the![]()
Unlock this Answer For Free Now!
View this answer and more for free by performing one of the following actions

Scan the QR code to install the App and get 2 free unlocks

Unlock quizzes for free by uploading documents