Multiple Choice
Figure 34-3. 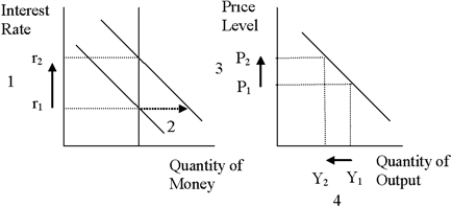
-Refer to Figure 34-3.What quantity is represented by the downward-sloping line on the left-hand graph?
A) the supply of money
B) the demand for money
C) the rate of inflation
D) Aggregate Demand.
Correct Answer:
Verified
Related Questions
Q57: According to the theory of liquidity preference,which
Q58: If people decide to hold less money,then
A)money
Q59: Figure 34-1 Q61: Figure 34-2.On the left-hand graph,MS represents the Q63: According to liquidity preference theory,if the quantity Q64: Figure 34-2.On the left-hand graph,MS represents the![]()
Unlock this Answer For Free Now!
View this answer and more for free by performing one of the following actions

Scan the QR code to install the App and get 2 free unlocks

Unlock quizzes for free by uploading documents