Figure 34-2
(a) The Money Market
(b) The Aggregate Demand Curve 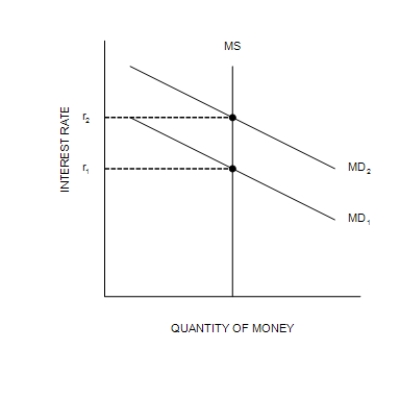
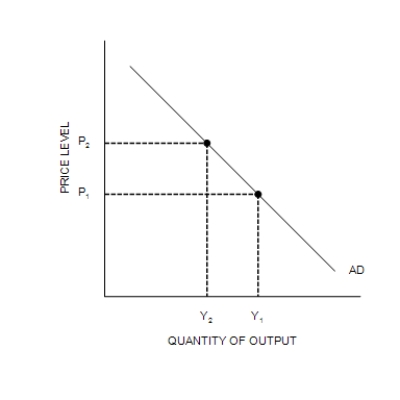
-Refer to Figure 34-2. A decrease in Y from Y1 to Y2 is explained as follows:
A) The Federal Reserve increases the money supply, causing the money-demand curve to shift from MD1 to MD2; this shift of MD causes r to increase from r1 to r2; and this increase in r causes Y to decrease from Y1 to Y2.
B) An increase in P from P1 to P2 causes the money-demand curve to shift from MD1 to MD2; this shift of MD causes r to increase from r1 to r2; and this increase in r causes Y to decrease from Y1 to Y2.
C) A decrease in P from P2 to P1 causes the money-demand curve to shift from MD1 to MD2; this shift of MD causes r to increase from r1 to r2; and this increase in r causes Y to decrease from Y1 to Y2.
D) An increase in the price level causes the money-demand curve to shift from MD2 to MD1; this shift of MD causes r to decrease from r2 to r1; and this decrease in r causes Y to decrease from Y1 to Y2.
Correct Answer:
Verified
Q126: As the interest rate falls to equilibrium
Q127: In recent years, the Federal Reserve has
Q128: Using the liquidity-preference model, when the Federal
Q129: Which of the following would not be
Q130: Liquidity preference theory is most relevant to
Q132: Monetary policy
A)must be described in terms of
Q133: Figure 34-2
(a) The Money Market
(b) The Aggregate
Q134: Figure 34-3
(a) The Money Market
(b) The Aggregate
Q135: According to the theory of liquidity preference,
A)an
Q136: While a television news reporter might state
Unlock this Answer For Free Now!
View this answer and more for free by performing one of the following actions

Scan the QR code to install the App and get 2 free unlocks

Unlock quizzes for free by uploading documents