Figure 34-6.On the left-hand graph,MS represents the supply of money and MD represents the demand for money;on the right-hand graph,AD represents aggregate demand.The usual quantities are measured along the axes of both graphs. 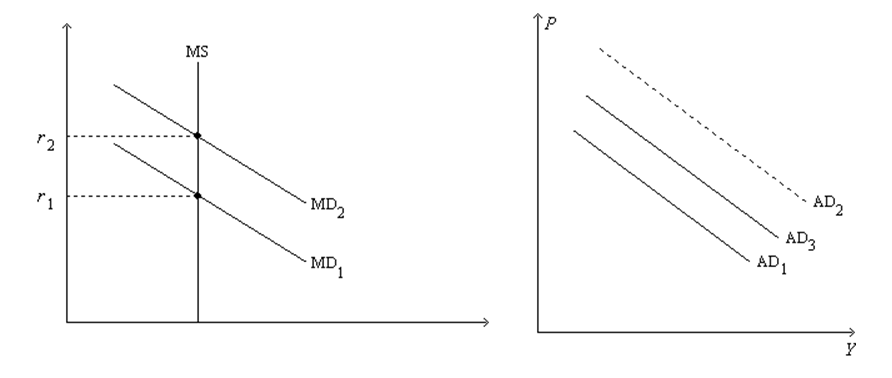
-Refer to Figure 34-6.Suppose the graphs are drawn to show the effects of an increase in government purchases.If it were not for the increase in r from r1 to r2,then
A) there would be no crowding out.
B) the full multiplier effect of the increase in government purchases would be realized.
C) the AD curves that actually apply,before and after the change in government purchases,would be separated horizontally by the distance equal to the multiplier times the change in government purchases.
D) All of the above are correct.
Correct Answer:
Verified
Q35: The government buys new weapons systems.The manufacturers
Q36: Suppose the multiplier has a value that
Q37: Which of the following events shifts aggregate
Q40: Figure 34-5.On the figure,MS represents money supply
Q41: Assuming a multiplier effect,but no crowding-out or
Q42: If net exports fall $40 billion,the MPC
Q43: The positive feedback from aggregate demand to
Q164: The process of the investment accelerator involves
A)positive
Q166: Scenario 34-1. Take the following information as
Q175: The government builds a new water-treatment plant.
Unlock this Answer For Free Now!
View this answer and more for free by performing one of the following actions

Scan the QR code to install the App and get 2 free unlocks

Unlock quizzes for free by uploading documents