Figure 34-6.On the left-hand graph,MS represents the supply of money and MD represents the demand for money;on the right-hand graph,AD represents aggregate demand.The usual quantities are measured along the axes of both graphs. 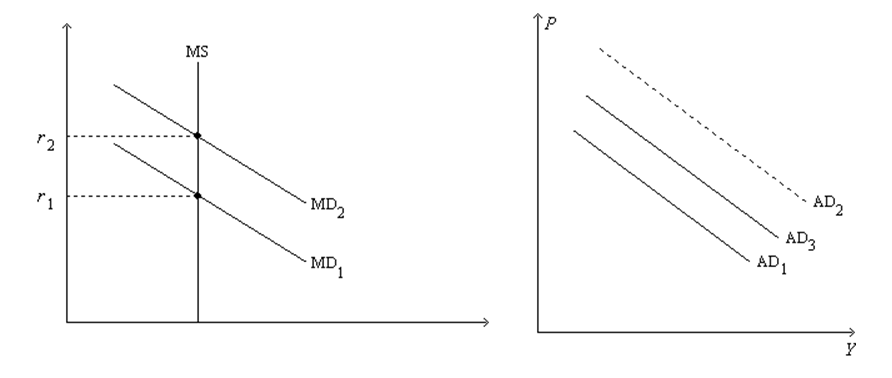
-Refer to Figure 34-6.Suppose the multiplier is 5 and the government increases its purchases by $15 billion.Also,suppose the AD curve would shift from AD1 to AD2 if there were no crowding out;the AD curve actually shifts from AD1 to AD3 with crowding out.Also,suppose the horizontal distance between the curves AD1 and AD3 is $55 billion.The extent of crowding out,for any particular level of the price level,is
A) $75 billion.
B) $40 billion.
C) $30 billion.
D) $20 billion.
Correct Answer:
Verified
Q25: The idea that expansionary fiscal policy has
Q26: Figure 34-5.On the figure,MS represents money supply
Q28: Which of the following tends to make
Q29: Figure 34-5.On the figure,MS represents money supply
Q31: The multiplier effect states that there are
Q32: The multiplier effect is exemplified by the
Q33: A decrease in government spending initially and
Q35: The government buys new weapons systems.The manufacturers
Q163: Scenario 34-1. Take the following information as
Q166: Scenario 34-1. Take the following information as
Unlock this Answer For Free Now!
View this answer and more for free by performing one of the following actions

Scan the QR code to install the App and get 2 free unlocks

Unlock quizzes for free by uploading documents