Figure 34-5.On the figure,MS represents money supply and MD represents money demand. 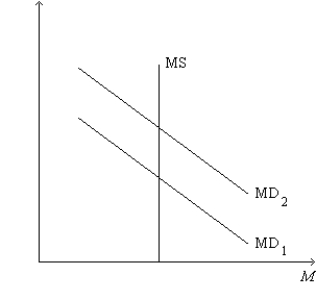
-Refer to Figure 34-5.A shift of the money-demand curve from MD1 to MD2 could be a result of
A) a decrease in taxes.
B) an increase in government spending.
C) an increase in the price level.
D) All of the above are correct.
Correct Answer:
Verified
Q22: An increase in government spending initially and
Q23: In order to simplify the equation for
Q24: Figure 34-6.On the left-hand graph,MS represents the
Q25: The idea that expansionary fiscal policy has
Q28: Which of the following tends to make
Q29: Figure 34-5.On the figure,MS represents money supply
Q30: Figure 34-6.On the left-hand graph,MS represents the
Q31: The multiplier effect states that there are
Q163: Scenario 34-1. Take the following information as
Q169: Scenario 34-1. Take the following information as
Unlock this Answer For Free Now!
View this answer and more for free by performing one of the following actions

Scan the QR code to install the App and get 2 free unlocks

Unlock quizzes for free by uploading documents