Table 5-7
The following table shows a portion of the demand schedule for a particular good at various levels of income. 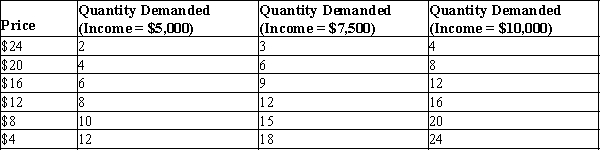
-Refer to Table 5-7. Using the midpoint method, when income equals $5,000, what is the price elasticity of demand between $8 and $12?
A) 0.56
B) 0.75
C) 1.33
D) 1.80
Correct Answer:
Verified
Q194: You and your college roommate eat three
Q247: Suppose the income elasticity of demand is
Q259: Danita rescues dogs from her local animal
Q260: Last year,Joan bought 50 pounds of hamburger
Q266: Heath's income elasticity of demand for concerts
Q268: Assume that a 4 percent decrease in
Q270: While in college,John and Bethany each buy
Q280: While in college,Marty and Laura each buy
Q513: Table 5-7
The following table shows a portion
Q519: Table 5-8 ![]()
Unlock this Answer For Free Now!
View this answer and more for free by performing one of the following actions

Scan the QR code to install the App and get 2 free unlocks

Unlock quizzes for free by uploading documents