Figure 5-4 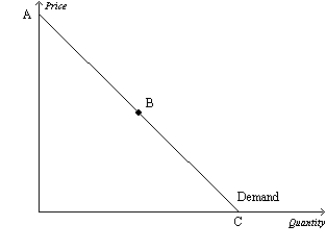
-Refer to Figure 5-4.Assume the section of the demand curve from A to B corresponds to prices between $6 and $12.Then,when the price increases from $8 to $10,
A) the percent decrease in the quantity demanded exceeds the percent increase in the price.
B) the percent increase in the price exceeds the percent decrease in the quantity demanded.
C) sellers' total revenue increases as a result.
D) it is possible that the quantity demanded fell from 550 to 500 as a result.
Correct Answer:
Verified
Q169: Your younger sister needs $50 to buy
Q186: Holding all other forces constant,if increasing the
Q187: Figure 5-4 Q188: Suppose a market has the demand function Q189: If the demand for textbooks is inelastic,then Q190: Holding all other forces constant,if decreasing the Unlock this Answer For Free Now! View this answer and more for free by performing one of the following actions Scan the QR code to install the App and get 2 free unlocks Unlock quizzes for free by uploading documents![]()

