Multiple Choice
Figure 7-3 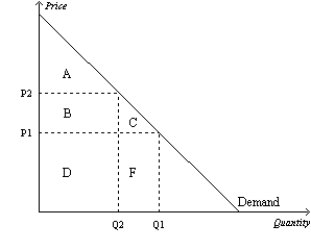
-Refer to Figure 7-3.Area C represents the
A) decrease in consumer surplus that results from a downward-sloping demand curve.
B) consumer surplus to new consumers who enter the market when the price falls from P2 to P1.
C) increase in producer surplus when quantity sold increases from Q2 to Q1.
D) decrease in consumer surplus to each consumer in the market when the price increases from P1 to P2.
Correct Answer:
Verified
Related Questions

