Multiple Choice
Figure 7-15 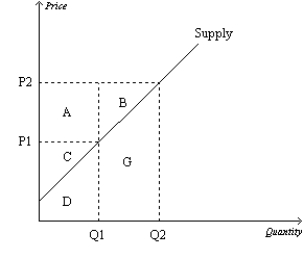
-Refer to Figure 7-15.Area A represents
A) producer surplus to new producers entering the market as the result of an increase in price from P1 to P2.
B) the increase in consumer surplus that results from an upward-sloping supply curve.
C) the increase in total surplus when sellers are willing and able to increase supply from Q1 to Q2.
D) the increase in producer surplus to those producers already in the market when the price increases from P1 to P2.
Correct Answer:
Verified
Related Questions

