Figure 8-24.The figure represents the relationship between the size of a tax and the tax revenue raised by that tax. 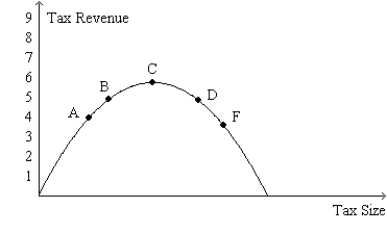
-Refer to Figure 8-24.Tax revenue would
A) decrease if the economy began at point B and then the tax rate was decreased.
B) increase if the economy began at point F and then the tax rate was decreased.
C) decrease if the economy began at point C and then the tax rate was increased.
D) All of the above are correct.
Correct Answer:
Verified
Q52: If the tax on gasoline increases from
Q53: Figure 8-22 Q54: Which of the following would likely have Q55: Figure 8-22 Q56: Figure 8-22 Q57: Figure 8-23.The figure represents the relationship between Q59: Which of the following statements is correct? Unlock this Answer For Free Now! View this answer and more for free by performing one of the following actions Scan the QR code to install the App and get 2 free unlocks Unlock quizzes for free by uploading documents![]()
![]()
![]()
A)A

