Figure 8-23. The figure represents the relationship between the size of a tax and the tax revenue raised by that tax. 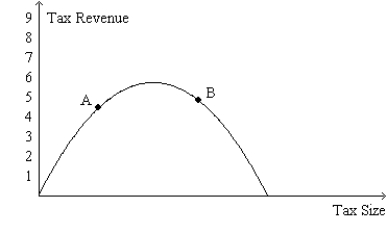
-Refer to Figure 8-23. If the economy is at point B on the curve, then an increase in the tax rate will
A) increase the deadweight loss of the tax and increase tax revenue.
B) increase the deadweight loss of the tax and decrease tax revenue.
C) decrease the deadweight loss of the tax and increase tax revenue.
D) decrease the deadweight loss of the tax and decrease tax revenue.
Correct Answer:
Verified
Q2: The size of the deadweight loss generated
Q3: When a tax is imposed on a
Q4: Which of the following statements is correct
Q6: The deadweight loss from a tax of
Q17: The price elasticities of supply and demand
Q18: Buyers of a product will bear the
Q57: Figure 8-23.The figure represents the relationship between
Q62: Figure 8-24.The figure represents the relationship between
Q127: Figure 8-23. The figure represents the relationship
Q161: The size of a tax and the
Unlock this Answer For Free Now!
View this answer and more for free by performing one of the following actions

Scan the QR code to install the App and get 2 free unlocks

Unlock quizzes for free by uploading documents