Multiple Choice
Figure 8-23.The figure represents the relationship between the size of a tax and the tax revenue raised by that tax. 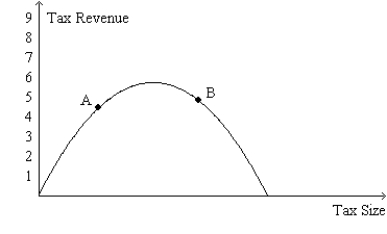
-Refer to Figure 8-23.The curve that is shown on the figure is called the
A) deadweight-loss curve.
B) tax-incidence curve.
C) Laffer curve.
D) Lorenz curve.
Correct Answer:
Verified
Related Questions

