Figure 8-21 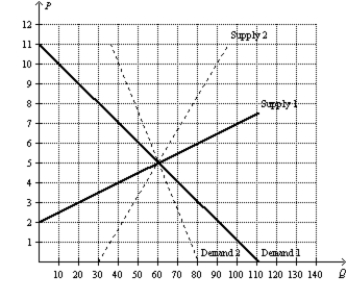
-Refer to Figure 8-21.Suppose the government places a $3 per-unit tax on this good.The largest deadweight loss from the tax would occur in a market where demand is represented by
A) Demand 1,and supply is represented by Supply 1.
B) Demand 1,and supply is represented by Supply 2.
C) Demand 2,and supply is represented by Supply 1.
D) Demand 2,and supply is represented by Supply 2.
Correct Answer:
Verified
Q44: Which of the following ideas is the
Q45: The Laffer curve illustrates that
A)deadweight loss rises
Q46: Figure 8-23.The figure represents the relationship between
Q47: Figure 8-20
On the vertical axis of each
Q48: In the early 1980s,which of the following
Q50: Figure 8-22 Q52: If the tax on gasoline increases from Q53: Figure 8-22 Q54: Which of the following would likely have Q56: Figure 8-22 Unlock this Answer For Free Now! View this answer and more for free by performing one of the following actions Scan the QR code to install the App and get 2 free unlocks Unlock quizzes for free by uploading documents![]()
![]()
![]()

