Figure 9-24
The following diagram shows the domestic demand and supply in a market.Assume that the world price in this market is $20 per unit. 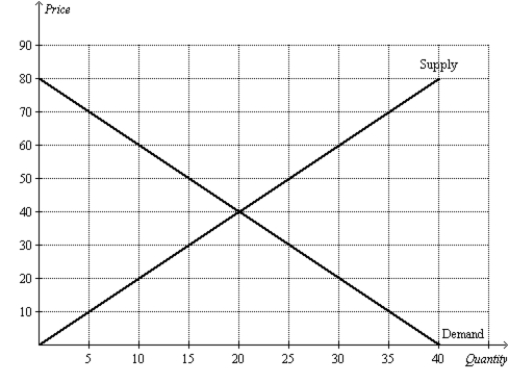
-Refer to Figure 9-24.Suppose the government imposes a tariff of $10 per unit.The deadweight loss caused by the tariff is
A) $25.
B) $50.
C) $75.
D) $100.
Correct Answer:
Verified
Q287: Figure 9-25
The following diagram shows the domestic
Q288: Figure 9-26
The diagram below illustrates the market
Q289: Figure 9-25
The following diagram shows the domestic
Q290: Figure 9-24
The following diagram shows the domestic
Q291: Figure 9-26
The diagram below illustrates the market
Q293: Figure 9-24
The following diagram shows the domestic
Q294: Figure 9-24
The following diagram shows the domestic
Q295: Figure 9-23
The following diagram shows the domestic
Q296: When a country opens up to trade
Q297: Mexico has imposed a tariff on the
Unlock this Answer For Free Now!
View this answer and more for free by performing one of the following actions

Scan the QR code to install the App and get 2 free unlocks

Unlock quizzes for free by uploading documents