Figure 9-22
The following diagram shows the domestic demand and domestic supply in a market.In addition,assume that the world price in this market is $40 per unit. 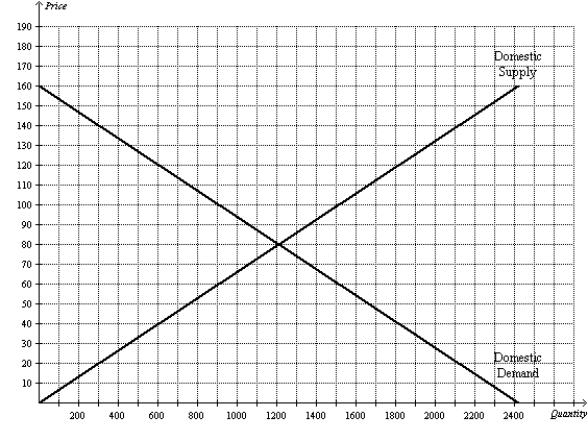
-Refer to Figure 9-22.Suppose the government imposes a tariff of $20 per unit.The amount of revenue collected by the government from the tariff is
A) $6,000.
B) $9,000.
C) $12,000.
D) $15,000.
Correct Answer:
Verified
Q269: Scenario 9-2
• For a small country called
Q270: Figure 9-22
The following diagram shows the domestic
Q271: Figure 9-21
The following diagram shows the domestic
Q272: Figure 9-23
The following diagram shows the domestic
Q273: Figure 9-22
The following diagram shows the domestic
Q275: Figure 9-21
The following diagram shows the domestic
Q276: Figure 9-21
The following diagram shows the domestic
Q277: Figure 9-23
The following diagram shows the domestic
Q278: Figure 9-23
The following diagram shows the domestic
Q279: Figure 9-22
The following diagram shows the domestic
Unlock this Answer For Free Now!
View this answer and more for free by performing one of the following actions

Scan the QR code to install the App and get 2 free unlocks

Unlock quizzes for free by uploading documents