Figure 9-21
The following diagram shows the domestic demand and domestic supply for a market.In addition,assume that the world price in this market is $40 per unit. 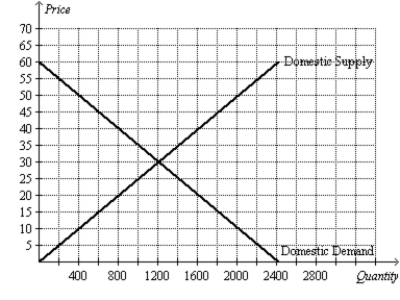
-Refer to Figure 9-21.With free trade,the domestic price and domestic quantity demanded are
A) $30 and 1,200.
B) $40 and 800.
C) $30 and 800.
D) $40 and 1,600.
Correct Answer:
Verified
Q258: Scenario 9-2
• For a small country called
Q259: Figure 9-20
The figure illustrates the market for
Q260: Figure 9-20
The figure illustrates the market for
Q261: Figure 9-21
The following diagram shows the domestic
Q262: Figure 9-22
The following diagram shows the domestic
Q264: Figure 9-22
The following diagram shows the domestic
Q265: Figure 9-23
The following diagram shows the domestic
Q266: Figure 9-22
The following diagram shows the domestic
Q267: Figure 9-22
The following diagram shows the domestic
Q268: When a country allows trade and becomes
Unlock this Answer For Free Now!
View this answer and more for free by performing one of the following actions

Scan the QR code to install the App and get 2 free unlocks

Unlock quizzes for free by uploading documents