Multiple Choice
Figure 9-18.On the diagram below,Q represents the quantity of peaches and P represents the price of peaches.The domestic country is Isoland. 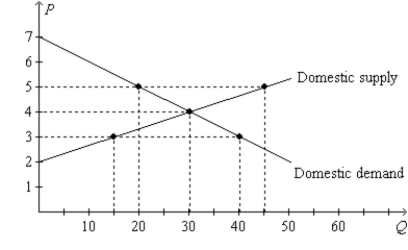
-Refer to Figure 9-18.Suppose Isoland changes from a no-trade policy to a policy that allows international trade.If the world price of peaches is $5,then the policy change results in a
A) $25 decrease in consumer surplus.
B) $20 increase in consumer surplus.
C) $25 decrease in producer surplus.
D) $20 increase in producer surplus.
Correct Answer:
Verified
Related Questions
Q200: Figure 9-6 Q213: Figure 9-17 Q214: Figure 9-18.On the diagram below,Q represents the![]()
![]()

