Multiple Choice
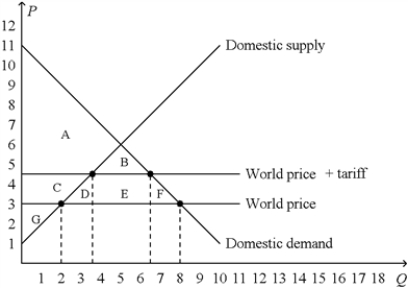
Figure 9-16.The figure below illustrates a tariff.On the graph,Q represents quantity and P represents price. 
-Refer to Figure 9-16.The area C + D + E + F represents
A) the decrease in consumer surplus caused by the tariff.
B) the decrease in total surplus caused by the tariff.
C) the deadweight loss of the tariff minus government revenue raised by the tariff.
D) the deadweight loss of the tariff plus government revenue raised by the tariff.
Correct Answer:
Verified
Related Questions
Q188: Figure 9-6 Q195: Figure 9-17 Q196: The nation of Aquilonia has decided to Q197: Import quotas and tariffs produce similar results.Which![]()
![]()

