Multiple Choice
Figure 9-8.On the diagram below,Q represents the quantity of cars and P represents the price of cars. 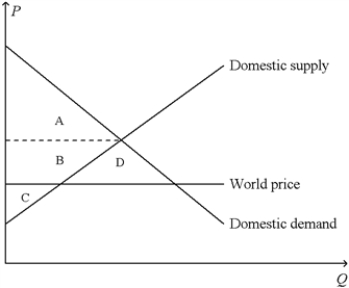
-Refer to Figure 9-8.In the country for which the figure is drawn,total surplus with international trade in cars
A) is represented by the area A + B + C.
B) is represented by the area A + B + D.
C) is smaller than producer surplus without international trade in cars.
D) is larger than total surplus without international trade in cars.
Correct Answer:
Verified
Related Questions
Q101: Figure 9-9 Q102: Figure 9-10.The figure applies to Mexico and Q103: Figure 9-10.The figure applies to Mexico and Q104: Figure 9-8.On the diagram below,Q represents the Q105: Figure 9-10.The figure applies to Mexico and![]()

