Figure 9-8.On the diagram below,Q represents the quantity of cars and P represents the price of cars. 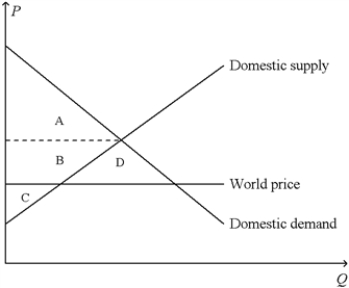
-Refer to Figure 9-8.When the country for which the figure is drawn allows international trade in cars,
A) consumer surplus increases by the area B.
B) producer surplus decreases by the area B + D.
C) total surplus increases by the area D.
D) All of the above are correct.
Correct Answer:
Verified
Q99: Figure 9-6
The figure illustrates the market for
Q100: Figure 9-7.The figure applies to the nation
Q101: Figure 9-9 Q102: Figure 9-10.The figure applies to Mexico and Q103: Figure 9-10.The figure applies to Mexico and Q105: Figure 9-10.The figure applies to Mexico and Q106: Figure 9-8.On the diagram below,Q represents the Q107: Figure 9-9 Q108: Figure 9-10.The figure applies to Mexico and Q109: Figure 9-9 Unlock this Answer For Free Now! View this answer and more for free by performing one of the following actions Scan the QR code to install the App and get 2 free unlocks Unlock quizzes for free by uploading documents![]()
![]()
![]()

