Figure 9-8.On the diagram below,Q represents the quantity of cars and P represents the price of cars. 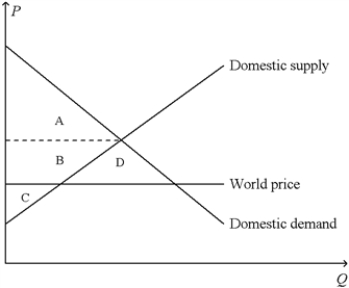
-Refer to Figure 9-8.The country for which the figure is drawn
A) has a comparative advantage relative to other countries in the production of cars and it will export cars.
B) has a comparative advantage relative to other countries in the production of cars and it will import cars.
C) has a comparative disadvantage relative to other countries in the production of cars and it will export cars.
D) has a comparative disadvantage relative to other countries in the production of cars and it will import cars.
Correct Answer:
Verified
Q107: Figure 9-9 Q108: Figure 9-10.The figure applies to Mexico and Q109: Figure 9-9 Q110: Figure 9-9 Q111: Figure 9-7.The figure applies to the nation Q113: Figure 9-11 Q114: Figure 9-9 Q115: Figure 9-10.The figure applies to Mexico and Q116: Figure 9-9 Q117: Figure 9-11 Unlock this Answer For Free Now! View this answer and more for free by performing one of the following actions Scan the QR code to install the App and get 2 free unlocks Unlock quizzes for free by uploading documents![]()
![]()
![]()
![]()
![]()
![]()
![]()

